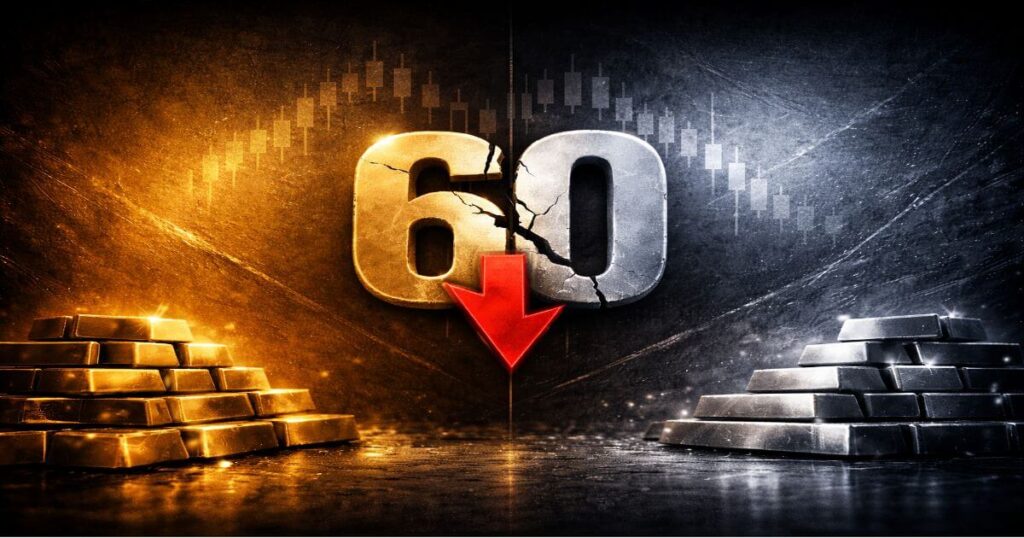
The forecast was spot on. Gold–Silver Ratio at 60… and it happened far faster than expected.
On December 2, in my research post, I analyzed the Gold-Silver Ratio around the 73 level and posed a key question: Was this the structural midpoint of the cycle—the “waist”—or the final flare of a late-stage rally? At the time, I argued that silver had a strong chance to outperform (Scenario B).
Just three weeks later, the market delivered a clear verdict. The Gold/Silver Ratio dropped sharply from 73 to 60.3.
[Read the previous post: Gold/Silver Ratio at 73 – Structural Mid-Cycle or Final Flare?]
In that earlier analysis, we described 73 as the “waist” of the cycle. Now we’ve moved beyond the waist—possibly toward the “chest,” and in a more aggressive scenario, even the “head” of the cycle.
In today’s post, I’ll break down what it means for the ratio to print 60 for the first time since 2014, and why this move should be viewed not as a simple price rally, but increasingly as a re-rating of silver as a strategic industrial asset.
Why Does a Gold–Silver Ratio of 60 Matter?
A Gold/Silver Ratio of 60 means one ounce of gold buys 60 ounces of silver. The lower the ratio, the more silver is appreciating relative to gold—often reflecting periods when silver is either leading the precious-metals complex or being repriced due to supply/demand conditions.
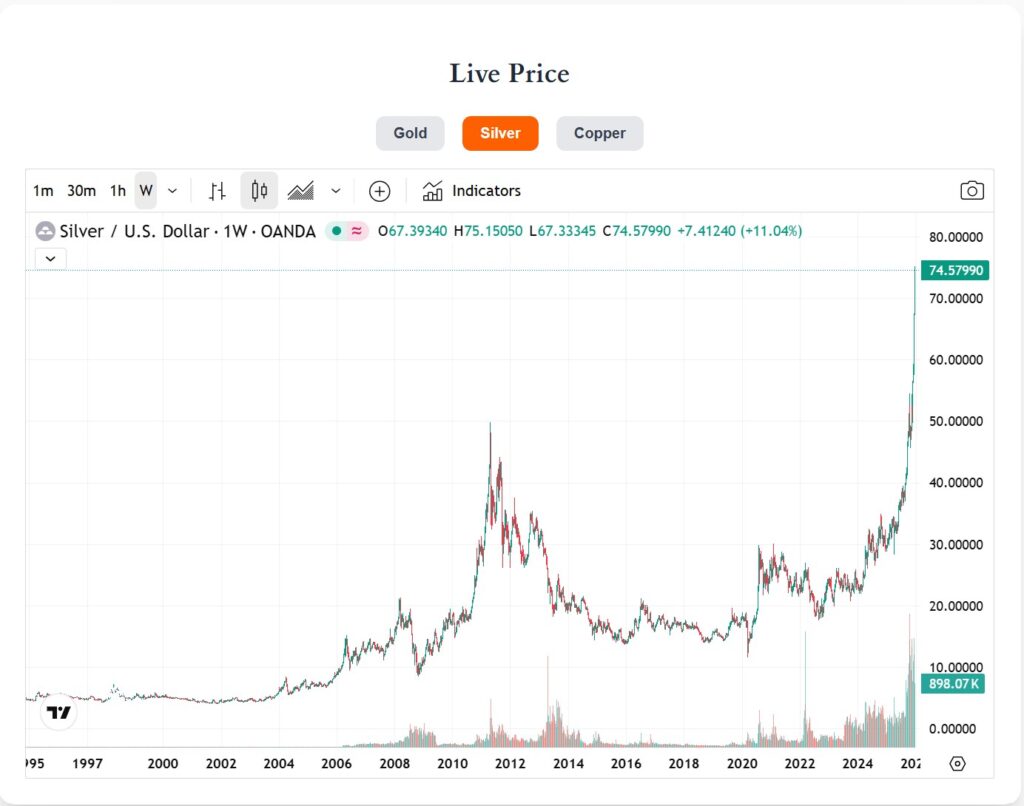
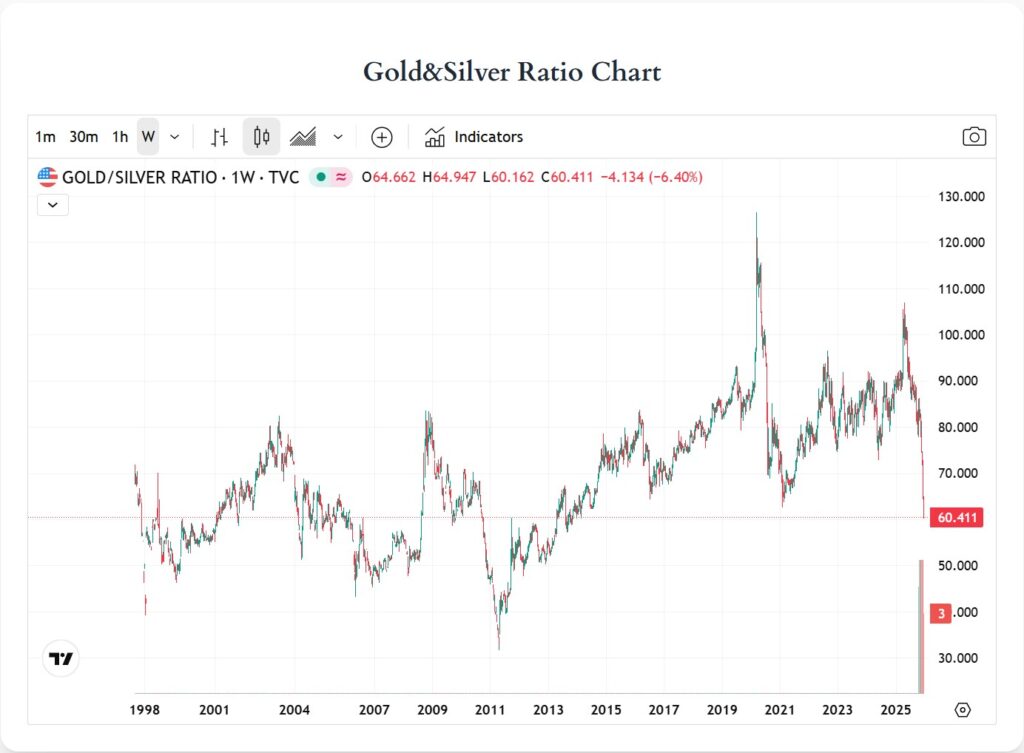
These two charts put the current move into perspective.
- In 2011, when silver approached $50, the ratio fell toward 30.
- In 2020, during peak pandemic fear, even as silver rose toward $30, the ratio surged to around 120, reflecting extreme relative weakness in silver versus gold.
Today’s 60.3 is significant because it has decisively broken below the lower boundary of the range that has held for roughly a decade since 2014. From a technical standpoint, this is one of the clearest signals that silver has stepped out of gold’s shadow and begun to trade in a more independent bull phase.
👉 [Check Real-time Gold/Silver Ratio Chart]
Gold Silver Ratio 60: Three Structural Triggers
Over the past three weeks, the market landscape has shifted materially. This is not simply a “weaker dollar” story. The fundamentals around silver have changed.
1. AI, Semiconductors, and the “Backbone of Industry”
According to a revised report from The Silver Institute, silver demand tied to AI data centers and next-generation semiconductor packaging has surged by more than 15% above prior estimates. Silver has the highest electrical conductivity of any metal. As chips become more advanced, silver becomes harder to substitute.
This matters because the current move increasingly reflects a supply-driven repricing of silver as an essential industrial input, not just a monetary hedge.
2. The Generational Shift in Solar (PV) Technology
As solar panel technology—led primarily by China—moves from P-type to N-type (TOPCon), silver usage per panel has reportedly increased by close to 50%.
This is not a short-lived demand spike. It is structural demand growth embedded in the global push toward net zero and electrification.
3. Exchange Inventory Depletion: The Limits of “Paper Silver”
The most critical variable is physical inventory.
According to the latest CME Group data, COMEX registered stocks—deliverable inventory available for immediate withdrawal—have fallen toward historic lows.
London tells a similar story. The Silver Institute has warned that Exchange for Physical (EFP) activity is accelerating, tightening the market further and deepening the structural supply deficit. Put simply: when physical delivery demand rises faster than available supply, it becomes increasingly difficult for paper markets alone to cap the price.
This dynamic raises the probability of short-squeeze-like behavior, especially in a market as tight—and as relatively small—as silver.
Future Scenarios: What Comes After 60?
The natural next question is straightforward: Does the ratio fall further (silver continues to explode), or does it rebound (silver cools off)? Here are the key scenarios investors should keep in view.
Scenario 1: A Replay of 1980 / 2011 (Target Ratio: 45–30)
If liquidity remains supportive and industrial demand continues to accelerate, 60 may not be a floor—it may simply be a checkpoint. In prior super-cycles, the Gold/Silver Ratio often traded around 40–50, and in extreme phases dipped below 30.
- Outlook: A sustained silver surge could push the ratio into the low 50s relatively quickly.
Scenario 2: A Technical Mean Reversion After Overextension (Back Toward 65)
On RSI, silver is now in overbought territory. If profit-taking increases and gold holds up better, the ratio could see a technical rebound toward the 65 region.
- Strategy: In this scenario, it can be sensible to avoid a “100% silver” stance and instead rebalance—raising some cash or rotating a portion into gold to reduce volatility.
Summary: Strategy by Gold/Silver Ratio Range
| Range | Current Status | Investment Strategy | Key Point |
| Above 73 | Undervalued (Prev. Analysis) | Consider gradual accumulation | Identifying the bottom & Buying zone |
| 60 ~ 65 | Current Position | Hold & Observe | Avoid chasing; Enjoy profits on holdings |
| Below 50 | Historically Overheated | Consider Partial Selling | Zone of Greed; Prepare to shift to Gold |
Conclusion: Is Your Portfolio Ready?
The Gold/Silver Ratio breaking down to 60 sends a clear message:
“Silver is no longer just gold’s supporting act.”
This is not necessarily the moment to rush to call a top and sell everything. Unless the structural deficit eases, the trend may persist and extend. At the same time, silver’s volatility can be ruthless—so this is also a moment to tighten risk controls and fasten the seatbelt.
Want to monitor the market in real time? Track premium analytics and live pricing on Korea’s leading premium-analysis platform, Goldkimp.com.
👉 [Check Real-time Korea Gold/Silver Premium]
Disclaimer: This content is for informational purposes and personal analysis only and does not constitute a recommendation to buy or sell specific assets. The final decision and responsibility for any investment lie solely with the investor.